Revista Cartográfica 100 - Artículos - ISSN
(impresa) 0080-2085 - ISSN (en línea) 2663-3981 - enero-junio 2020: 81-94
DOI https://doi.org/10.35424/rcarto.v0i100.642
Admissible relative errors of the parcel area
while creating a land parcel map base using an
orthoimage as a reference
Determinación de errores admisibles en el área
de las parcelas al ajustar un parcelario usando un
ortomosaico de referencia
Irene Balado*
Carlos
López-Vázquez**
Received October 17, 2018; accepted February 20, 2019
Abstract
Currently the official land parcel map of
Uruguay does not allow a suitable interoperability with other available
geographic information. We are considering using a national high accuracy and
high resolution orthomosaic in two ways: either to
support the creation of a brand new land parcel map or to allow amending the
existing one. In particular, the present work is part of a set of experiments
which considers different techniques to amend the existing land parcel map. In
order to perform a fair comparison it is necessary to have test cases produced
with a reference procedure properly and objectively evaluated. The metric of
success will be used as attainable goal for any other alternative. Using the orthomosaic in order to identify the apparent limits of
parcels in the land parcel map we were able to modify its location, thus making
the map interoperable with the image. In order to
measure the accuracy of the fit, we used the relative difference between the
area declared at the parcel map (taken as the
reference value) respect to the one computed from the GIS. We found that the
discrepancy between the areas computed from the initial and the final dataset
w.r.t.
the declared area decreases, but not up to expected level. Once filtered for
outliers the remaining discrepancies follow a normal distribution, where its
bias and standard deviation varies from (-0.65%, 11.24%) before editing to (1.72%,
8.59%) later. Despite the drastic change in planimetric accuracy the
improvement of the area accuracy is marginal. Considering the admissibility
criteria of the Uruguayan National Cadastral Office, for the legacy dataset
only 39.4% parcel maps could be accepted, a value which improves up to 49.7%
after the manual edition. It is still far from the goal of 100%, and the
reasons for such pessimistic finding will be discussed.
Keywords: Apparent Cadastre, Geometric Interoperability, Conflation, Land parcel map.
Resumen
El parcelario vectorial
oficial de Uruguay actualmente no permite una adecuada interoperabilidad
geométrica con el resto de los datos geográficos disponibles. Pronto existirá
un ortomosaico nacional de imágenes de alta exactitud
y resolución, el cual podría utilizarse de dos formas: o bien para apoyar la
creación de un nuevo parcelario vectorial o bien para intentar corregir el
existente. El presente trabajo es parte de experimentos que analizan diferentes
técnicas de corrección geométrica semiautomática del parcelario existente. Para
valorar lealmente la bondad de esos procedimientos, es necesario generar un
caso de referencia con un procedimiento también de referencia y medir
objetivamente la exactitud obtenida, la que luego se utilizará como meta en el
proceso alternativo. Utilizando un ortomosaico
controlado se ajustó el parcelario vectorial a los límites aparentes. Para
medir la bondad del ajuste, se utilizó la discrepancia relativa de las áreas de
la mensura y la calculada por el SIG. En este artículo se muestra que con las
imágenes disponibles y los procedimientos utilizados la discrepancia entre las
áreas de las parcelas derivadas del parcelario y las declaradas en las mensuras
disminuye tras la edición, pero no tanto como se esperaba. Si se filtran los
casos de parcelas con errores descomunales el resultado es de distribución
normal, y sus parámetros (media, desviación estándar) pasan de (-0.65%, 11.24%)
antes de la edición a (-1.72%, 8.59%) luego de ella. La conclusión es que la
mejora obtenible tras este procedimiento de edición es marginal, al menos
cuando el error es medido en relación al ajuste del área de la mensura. Con los
criterios de DNC serían admisibles hoy apenas el 39.4% de las parcelas,
subiendo ese valor en el nuevo parcelario a 49.7%, aún muy lejos del 100% que
sería deseable. Se plantea una discusión sobre las posibles causas de este
resultado pesimista.
Palabras clave: catastro aparente, interoperabilidad geométrica, conflación, parcelario.
Introduction
In Uruguay the Cadastre has covered all the country for more than a century (Guerra Daneri, 1999; Erba, 2005) with the sole exception of the public access areas which are administered separately. The cartographic base is the survey map, a document which describes the geometry of the parcel made by professional surveyors working as freelancers. The National Cadastre (Dirección Nacional de Catastro, hereinafter DNC) collects all the individual parcel maps into a single graphical document (the land parcel map) which is updated continuously (Erba, 2005) by adding any change as far as it happens.
Aside
from its geometry, the attributes of the parcel includes a numerical id, owner,
critical dates, etc., as well as side lengths and the area. In particular the
area is a very important value, with effects on taxes. The declared area is
computed by the acting surveyor using raw field data and not computed from the plan.
Due to this, in
The
current land parcel map of Uruguay (created in digital form from 1995 to 1999)
holds nearly 250.000 rural parcels. According to Barreto et al. (2010)
and Faure Valbi et al. (2010) it has a
planimetric accuracy of the order of 200 m in the 95% confidence level, a value
which precludes its joint use with other geographic information of similar
scale. In addition to this problem (related with absolute coordinates) it is
important to take into consideration the local regulations. In
dismiss the old value. With the legacy land parcel map the situation today is
that from its 250.000 rural parcels after comparing the computed area only 36%
differs less than 5% w.r.t. its declared area. The accuracy of a land parcel
map in terms of the parcel area is barely mentioned in the literature, which
prefers the planimetric
accuracy and do not mention neither the area nor length accuracy.
If the situation is that there is no legacy dataset to work with, the ideal procedure to have an accurate land parcel map with accurate absolute coordinates, area and side lengths would be to repeat the surveyors work in every parcel, using high accuracy technologies today available. In practice such approach is impossible, considering cost, time and even legal reasons. Once we discard the extreme solution, one possible technical alternative is to build the land parcel map from a high resolution and high accuracy orthoimage.
Under the assumption that the manual edition would be the ideal procedure for this (but not necessarily the cheapest), in this work we want to measure the accuracy that could be achieved with the process using metrics related with the parcel area and not merely the absolute coordinates. Under the assumption that a legacy land parcel map, updated and completely operational is available, the outcome of this work can be used as a reference in order to compare with alternative procedures yet to imagine, including automatic image processing, mathematical massive transformation of the coordinates, building from scratch using individual land parcel maps, and any other alternative.
State of the Art
Historical aerial imagery are very important in order to detect changes in ecological factors, forest, land use administration, coastal management (Ratcliffe, 2001; Nagarajan and Shenk, 2016). They are also important in order to develop a Land Administration System (Cadastre) offering a suitable base for either manual or automatic map making (Ali et al., 2012).
A land parcel map is a live dataset, with daily changes that imply a costly, permanent and though task. Keeping pace with the cadastral regular updates poses a significant effort to other public services companies (electric power, waterworks, sewage, etc.) to assure interoperability with their own data, typically requesting to edit their own information in order to fit the land parcel map (Merrit and Masters, 1999).
It
is possible to adjust the geometry of a land parcel map using an orthoimage
either by automatic procedures or manually. For the former, as a first step it
requires to properly match homologue objects that exist in both datasets. Ruiz-Lendínez et al. (2017) reported the process used to
automatically identify control points related with crossing roads. The
algorithm described improved the performance over earlier
results, still with some difficulties in urban areas. Despite the detail, they
do not offer any quantitative result in terms of area or positional accuracy. Trias-Sanz et al. (2007) went beyond that, because
they presented a couple of algorithms able to, after identify borders in the
image (likely related with parcel limits, roads or avenues, walls, etc.),
matching such linear features with the equivalent limits existing in the land
parcel map. Even though they offer some experimental results, they are not
presented in terms of positional or areal accuracy but just in the matching
stage. In the same topic, Kohli et al. (2017) recently quantified the
probability of finding parcel limits as a function of the landscape type
observed from high resolution images, concluding that such probability is
highly dependent on the morphology but also in social issues. Thus, the
possibility of building a land parcel map from an image is very dependent on
the landscape.
In most of the papers on the topic the possibility to properly and accurately define the parcel limits from details in the orthoimage is taken for granted. Burns and Brown (1978) developed a statistical model based upon the binomial distribution to characterize the interpreter perception. The problem under research is the identification of lines and other geological discrete events in optic images. Their experiment required overlapping a transparent film over an image, drawing the detected lines, and later scanning the film with a 0.5 mm resolution. Each pixel with a mark is denoted to 1 and otherwise it is set to 0. After processing at least three independent interpreters they numerically estimate the parameters of the binomial distribution. Afterwards, they use them to assign a probability to each pixel instead of mere counting black and white ones. Despite they characterized the probability that the true line indeed goes through a particular pixel, in the model they did not considered at all the positional error of the line. Unfortunately, to the author’s best knowledge, this topic has been barely reported in the literature.
The method used in this paper has some links to the ones used by Ondulo and Kalande (2006) and Sengupta et al. (2016). They evaluated the discrepancies in terms of areas between the survey plan and the land parcel map considering the technical, legal and economical impacts. Ondulo and Kalande (2006) reported a parcel area discrepancy in some cases larger than 50% in a land parcel map build from aerial photographs from Kenya scanned, rectified, georreferenced and later projected in UTM using WGS 84. For further analysis they filtered out those cases which differ more than 20% from the recorded area value. They concluded that to lower such differences the planimetric accuracy of the land parcel map should not be larger than 2 m. To achieve that, they suggest using panchromatic images of 1 m resolution or multispectral images of 4 m resolution. They also reported that a clear direct relation exist between the relative error of area and the area itself.
Sengupta
et al. (2016) also edited the position of the corners of the parcels in
a legacy land parcel map using orthoimages as the reference. The corners were
modified through an affine transformation taking into consideration the
location of 10 to 15 control points found also in the image. In this case, the
reference area of the survey plan was not produced by the surveyor himself
using the field data book, but from the already built land parcel map, so its
own accuracy is limited. The relative errors after the geometric transformation
were almost always below 2%, but the
errors before the transformation were not reported.
Srinivas
et al. (2012) build a brand new land parcel map using an orthoimage at
scale 1:10.000 and they reported the resulting accuracy in terms of length. The
relative error of the image was of the order of 0.07%. The legacy and the new
land parcel map have discrepancies in length of the order of 5%, but
unfortunately they did not mention the area.
In
this paper we took into consideration the literature in order to assess the
relative error of the legacy land parcel map. We requested the opinion of some
surveyors about the expected discrepancy between the geometric area of a survey
plan and the numeric value stated there. In relatively modern survey maps, the
computation is performed by the CAD so the error is negligible. In older works,
the stated area was calculated directly from the field data book and afterwards
the map was drawn independently from the computations. The experts stated that
relative error of the area might be not more than a few per cents. According to
the present rules, in
The initial goal of this project was to measure the accuracy of an improved land parcel map using the relative area error. We evaluated with such metric both a legacy parcel map as is and its modified version using an orthoimage as the reference.
Data and methods
The reference base
used to edit the land parcel map both at suburban and rural areas was an
orthoimage scale 1:25.000. The flight by the Uruguayan Air Force took place in
1987 over the Canelones county along lines parallel to the coastline. It
covered a geological structure associated to a paleorelief
with heights not exceeding 20 m, leading to a smooth and undulated
geomorphology (Goso et al., 2017). Its pre-Holocen and Holocen sediments gave
pace to valleys oriented NNW-SSE of fluvial cycles of the rivers Solis Chico
and Solís Grande, used as East and West limits for the orthoimage (see Figure 1). The scanning process was performed to 15 micres
in the Military Geographic Service (SGM) and the aerotriangulation was generated with the Trimble Inpho Match-AT (Aerial Frame Triangulation version 7.1.3)
specifying a pixel size of 50 cm. After that a Digital Terrain Model
(comprising a Digital Elevation Model and a Digital Surface Model) was built
using 26 control points. Then, a second field work campaign was performed
gathering 24 new independent control points, and with them the NSSDA (FGDC, 1998) planimetric
accuracy was estimated as 3.2 m at the 95% confidence level. The parameters
(accuracy and resolution) of this orthoimage are comparable to those of an
ongoing national flight, which by contract requested images of 0.50 m
resolution and 3.0 planimetric accuracy.
The legacy land parcel map for the rural area has known geometric problems. Its accuracy was computed for some areas giving values of the order of 200 m (Faure Valbi et al., 2010; Barreto et al., 2010), 276 m or even 136 m (López-Vázquez, 2014). Comprising nearly 250.000 parcels, only 36% of the survey plans has a declared area which differ less than 5% with the existing digital land parcel map. On the other side, nearly 15% has discrepancies larger than 50%, differences that can not be attributed only to graphical problems. From the national land parcel map only those parcels completely included in the image were considered further. For each parcel the polygon’s area were evaluated before edition (Figure 2) and after edition (Figure 3), both using ArcGIS 10.0.
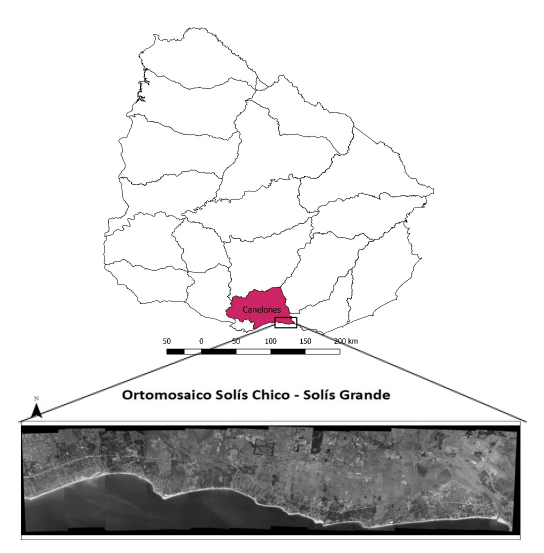
Figura 1. Location of the study area. The Canelones county is denoted in colour. The West and East limits of the orthoimage are the rivers Solís Chico and Solís Grande.
Source: Own elaboration.
The edition to match the image was a manual process. After an interpretation of the parcel limits in the image we modified the location of the parcel corners. Thus, and without independent information, we should accept that the resulting planimetric accuracy is of the order of the one estimated for the orthoimage.
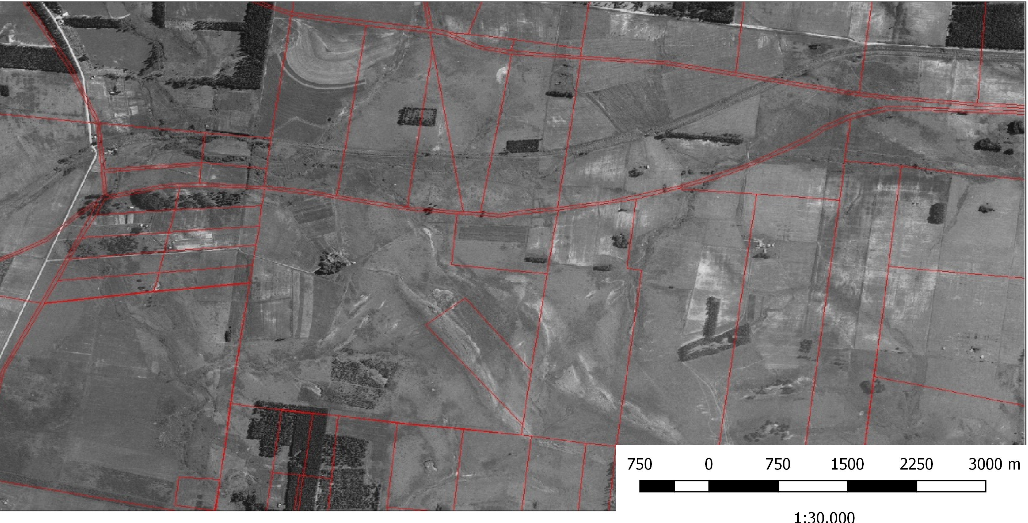
Figura 2. Illustration of part of the land parcel
map before edition, with the image as background. Notice that there are
displacements which easily exceed 200m.
Source: Own elaboration.
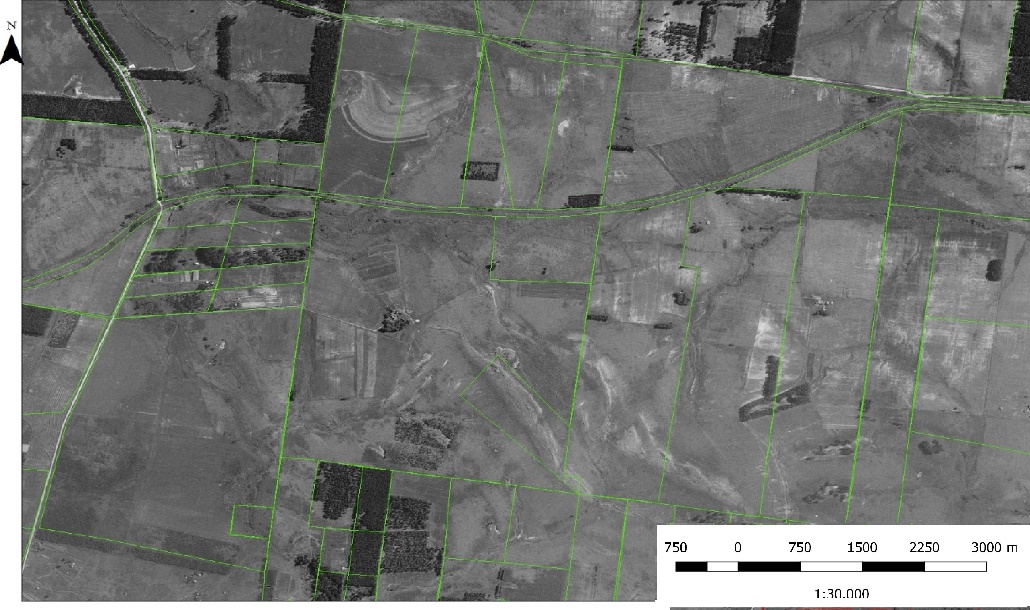
Figura 3. Illustration of the final land parcel
map, after manual edition to fit the image.
Source: Own elaboration.
Methodogical Issues
Both systematic and random errors are
unavoidable while digitizing land parcel maps (Tong et al., 2005). While
analyzing pre and post edition relative errors we found some large outliers.
Such disagreement might be related to an identification problem of the proper
survey plan, which despite having the same parcel number it has
suffered some fusion/division later which was not adequately recorded in the
land parcel map, or a yet unexplained error at the moment of digitizing. In any
case, and for this work, such cases were removed from further consideration.
During the edition stage we
found some difficulties associated to the visual interpretation of parcel
limits (typically denoted by wires). In some cases we found wires, but they
were not related with the parcel limit but with some internal ones, delimiting
cattle areas, agricultural uses, forest, etc. In others, the rivers either
removed the wires in a flood or we suspect that the wires have never existed,
because it is very common that rivers that are also natural boundaries for the
parcels are not limited by wires or walls. It is also possible that, after a
parcel division, there is no effort to denote such new situation in the field.
Finally, we have to mention the trivial case of some parcel limits that simply
cannot be discerned in the image, due to the lack of contrast between textures,
similar color or by rocky bed that precludes easy identification. In all such
cases such parcels were removed from further analysis, because to find a
solution might require a specialized effort not considered in the research.
Results
The results have shown that, given the available images and the procedures followed, we were able to diminish the overall discrepancy between the areas computed from the land parcel map geometry and those declared by the surveyors in the survey plan. For the experiment we have considered nearly 9600 ha, being 80% of them rural parcels. Individual parcel areas range from 293 to 0.018 ha in rural areas and from 13.5 to 0.017 ha in urban areas.
The
universe of relative errors of the area is a mix between a normal distribution
and other with more extreme values. If we remove all those cases with an
absolute relative error larger than 25% (a discrepancy which safely we can
attribute to non-geometric problems) both the initial and final relative error
verify the Kolmogorov test of normality with a 95% confidence level. The
initial universe comprises 477 parcels; after the filtering only 399 remain of
the initial dataset and 415 of the final one after edition (Figure 4). The parameters of the
normal population for the initial land parcel map were -0.65% as bias and
11.24% for the standard deviation, while for the edited version they were
-1.72% and 8.59% respectively. The
associated histograms are presented in Figure 5.
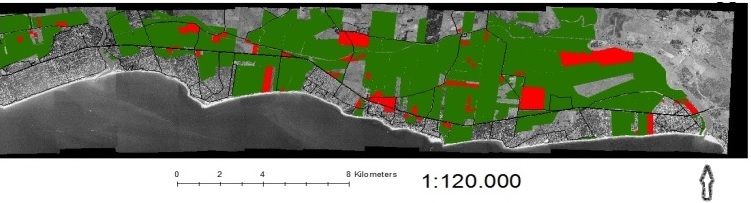
Figure 4. Location of those parcels with extreme discrepancies in area relative
error. In green we show those parcels which relative area error belongs to the
interval
[-25%,+25%] and in red those with larger values. Non coloured cases denotes
parcels without enough information to perform the computations.
Source: Own elaboration.
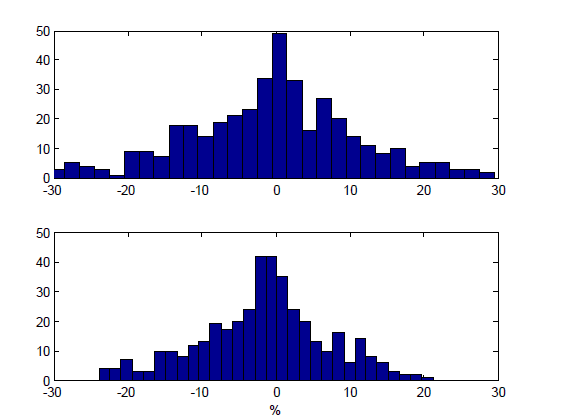
Figure 5. Histogram of the relative area errors before (top) and after (bottom)
the
edition (in %).
Source: Own elaboration.
Discussion
Before starting the research, we anticipated small differences between the legacy land parcel map parcel areas and those values declared in the survey plan, and that such differences could be diminished drastically after the edition. Both proved to be false. Some large discrepancies, exceeding 25%, forced us to remove some parcels from further analysis because it was assumed that the differences are not due to geometrical problems. Once the outliers were removed, we confirmed through the Kolmogorov test at the 95% confidence level that the remaining relative errors belong to a normal distribution. We estimated the standard deviation before and after the edition, rendering values of 11.24% and 8.59% respectively. With such results at hand, we confirmed that the relative error in area diminishes after the edition, but not in the expected amount.
In Uruguay, the regulations state that a new survey plan for a already existing parcel might differ from early values in no more than 5% in area, and up to 2% in lengths in order to be accepted by the DNC without further explanation (Resolución 24/996). That rules offered a second metric to assess the improvements after the edition.
The planimetric accuracy of the image (according to FGDC, 1998) is of 3.2 m, slightly larger than the recommended value of Ondulo and Kalande (2006) which suggest 2 m. The pixel size of the image was 0.50 m, while Sengupta et al. (2016) used a similar orthoimage with pixel size 0.45 m. We might suspect that both the orthoimage accuracy and resolution might explain the remaining relative error of the parcel areas, but there is not enough information in the literature to check. Notice that the planimetric accuracy of the land parcel map was drastically improved, decreasing from something of the order of 200 m down to 3.2 m, but the accuracy in terms of area did not improve as much.
The Apparent Cadastre, edited after interpretation of the orthoimage only has planar coordinates X and Y, and thus the height was dismissed. According to Rodríguez (2000) this might explain having a difference with the area from the image (which neglects the height) with the area directly computed from the field data book, which considers the terrain height.
Conclusions
Most of the literature related with cadastral accuracy improvement put focus on the planimetric error. In this work we attempted to quantify the impact of a particular methodology, namely manual edition with interpretation of a background reference image, in terms of the relative error of the parcel area. After filtering out outliers, we confirmed that the initial relative error follows a normal distribution, with standard deviation 11.24%. Taking into consideration the uruguayan regulations, if the land parcel map was used as the reference, only 39.4% of the survey plans will be admissible by the DNC. Despite coming from a small sample, this value is representative of the situation for the whole country, which accounts for 36%. The workaround of using the apparent parcel limits inferred from the image was not as efficient as expected, just lowering the standard deviation of the resulting population from 11.24% to 8.59%. According to DNC rules, the rate of admissible parcels against the edited land parcel map increased in turn to 49.7%. The planimetric accuracy was not measured independently of the image, but was deemed to be drastically better than the legacy values (3.2 m vs. 200 m).
There are a number of parcels which differ too much from their geometric counterpart, a difference that was not solved after the edition. Thus, in order to perform a Cadastral Upgrade Project, a first step must identify and solve through a careful analysis by surveyors of the available documents before going into the edition.
Finally, it should be mentioned that since the Decree 318/995 the surveyor must include in the survey plan a table with coordinates in a local, orthogonal system of every corner of the parcel. That is good, but might not be enough. One possible improvement for the future could be that, aside of the polyester analog map already requested, the surveyor should provide a digital file with the parcel corners in absolute coordinates. That way it will be possible (and hopefully easier) to check parcel side lengths against the neighbors, as well as to check the area against earlier information, all during the evaluation process of the survey map.
Acknowledgements
This work could not have been done without the support of the Director and personnel of the Geodesy and Topography Division and the Restitution and Photogrammetry Division of the Military Geographic Service of Uruguay. We want to mention also the support of Mr. Ing. Agrim. Hebenor Bermúdez, who provided references and valuable advice for the task.
References
Ali, Z.;
Tuladharb, A. and Zevenbergen, J. (2012). “An integrated approach for updating
cadastral maps in Pakistan using satellite remote sensing data”, International Journal of Applied Earth Observation
and Geoinformation, vol. 18, 386-398. https://doi.org/10.1016/j.jag.2012.03.008
Barreto, L.; Bermúdez, H.; Blanco, D.; Di Leoni, A.; Faure, J.; Méndez Baíllo, R.; Pérez Rodino, R.; Sánchez, M.; Striewe Dieste, E. (2010). “Evaluación de la Calidad de la Exactitud Geométrica Absoluta del Parcelario Rural Digital Vectorial del Departamento de Lavalleja”, Agrimensura, vol. 44, 2-7.
Burns, K.L.
and Brown, G.H. (1978). “The Human Perception of Geological Lineaments and
other Discrete Features in Remote Sensing Imagery: Signal Strengths,
Noise Levels and Quality”, Remote Sensing of Environment, vol. 7,
163-176. https://doi.org/10.1016/0034-4257(78)90045-7.
Decreto 318/995 (1995). “Registración de Firma y
Título Profesional en la Dirección
General del Catastro Nacional. Planos de Mensura”, Uruguay. Recuperado de http://cort.as/-1694.
Erba, D.A. (2005). “Historia del Catastro
Territorial en Latinoamérica: los países del
Conosur”, CT Catastro,
no. 53, 41-57.
Faure Valbi, J.; Blanco, D.; Bermúdez, H.; Méndez-Baíllo, R.; Barreto, L. y Striewe, E. (2010). “Evaluación de la calidad de la exactitud geométrica absoluta del parcelario rural digital vectorial del Departamento de Lavalleja”, Proyecto de Instituto de Agrimensura, Facultad de Ingeniería, Universidad de la República (unpublished), 37 pp.
FGDC (1998).
“Geospatial Positioning Accuracy Standards Part 3: National Standard
for Spatial Data Accuracy”, Federal Geographic Data Committee, FGDC-STD-
007.3-1998, 28 pp. https://www.fgdc.gov/standards/projects/FGDC-standards-projects/accuracy/part3/chapter3.
Goso, C.; Faure, J.; Pratto, D.; Barreto, L.; Picchi, D.; Scaglia, F.; Paris, A.; Samaniego, L.; Ubilla, D. y García, G. (2017). “Vulnerabilidades Geoambientales de la costa del Departamento de Canelones”, Nuevas miradas a la problemática de los ambientes costeros. Sur de Brasil, Uruguay y Argentina, Goso, César (comp. y rev.), DIRAC-Facultad de Ciencias, Cap. 8, 172-196.
Guerra Daneri, E.
(1999). “La estructura Catastral del establecimiento rural”, Revista de la
Facultad de Derecho (2a época), no. 16, 177-195. Recuperado de https://revista.fder.edu.uy/index.php/rfd/article/view/312.
Kohli, D.;
Bennett, R.; Lemmen, C.; Asiama,
K. and Zevenbergen, J. (2017). “A Quantitative
Comparison of Completely Visible Cadastral Parcels Using Satellite Images: A
Step towards Automation”, FIG Working Week 2017 Surveying the world of tomorrow
- From digitalisation to augmented reality Helsinki,
Finland, May 29-June 2, 14 pp.
López-Vázquez, C. (2014), “Mejora de Exactitud Posicional: ejemplo para el caso del CONEAT“, II Jornadas de Cartografía, 30-31 octubre, Montevideo, Uruguay, 10 pp.
Merrit,
R. and Masters, E. (1999). “Digital cadastral upgrades-A Progress report”,
Proceedings of the First International Symposium on Spatial Data Quality, Hong
Kong, 180-188.
Nagarajan, S.
and Schenk, T. (2016), “Feature-Based registration of historical aerial images
by Area minimization”, ISPRS Journal of
Photogrammetry and Remote Sensing, vol. 116, 15-23.
Nagarajan, S.
and Schenk, T. (2016), “Feature-Based registration of historical aerial images
by Area minimization”, ISPRS Journal of
Photogrammetry and Remote Sensing, vol. 116, 15-23. https://doi.org/10.1016/j.isprsjprs.2016.02.012.
Ondulo J.D. and Kalande W. (2006). “High Spatial Resolution Satellite
Imagery for PID Improvement in
Kenya” Shaping the Change XXIII FIG Congress, Munich, Germany, October 8-13, 9
pp.
Ratcliffe,
J.H. (2001). “On the accuracy of TIGER-type geocoded address data in
relation to cadastral and census areal units”, Int. J. Geographical
Information Science, vol. 15, no. 5, 473-485. https://doi.org/10.1080/13658810110047221.
Resolución 24/996 (1996). “Uniformización de
normas de planos de mensura, copias,
formatos, escalas”, Dirección Nacional de Catastro, Uruguay. Recuperado de http://cort.as/-1iPz.
Rodríguez, I. (2000). “La imagen digital en el Catastro, aplicaciones en la realización de la cartografía catastral”, Catastro CT, no. 38, 61-76.
Ruiz-Lendínez, J.J.; Maćkiewicz, B.; Motek, P. and Stryjakiewicz, T.
(2017). “Method for an automatic alignment of imagery and vector data applied
to
cadastral information in Poland”, Survey Review, 12 pp.
https://doi.org/10.1080/00396265.2017.1388959.
Sengupta, A.; Lemmen,
C.; Devos,W.; Bandyopadhyay, D.; Van der Veen, A. (2016). “Constructing a seamless digital
cadastral database using colonial cadastral maps and VHR imagery: an Indian
perspective”, Survey Review, vol. 48, No. 349, 258-268. https://doi.org/10.1179/1752270615Y.0000000003.
Srinivas, P.;
Raghu Venkataraman, V. and Jayalakshmi, I. (2012). “Digital Aerial Orthobase for Cadastral Mapping”, J Indian Soc Remote
Sens, vol. 40, no. 3, 497-506. https://doi.org/10.1007/s12524-011-0183-2.
Tong, X.; Shi,
W.; Liu, D. (2005). “A Least Squares-Based Method for Adjusting the Boundaries
of Area Objects”, Photogrammetric
Engineering & Remote Sensing, vol. 71, no. 2, 189-195.
Tong, X.; Shi,
W.; Liu, D. (2005). “A Least Squares-Based Method for Adjusting the Boundaries
of Area Objects”, Photogrammetric Engineering & Remote Sensing, vol.
71, no. 2, 189-195. https://doi.org/10.14358/PERS.71.2.189.
Trias-Sanz,
R.; Pierrot-Deseilligny, M.; Louchet,
J. and Stamon, G. (2007), “Methods for Fine
Registration of Cadastre Graphs to images”, IEEE
Transactions on
Pattern Analysis and Machine Intelligence, IEEE, vol. 29, no. 11, 1990-1201
https://doi.org/10.1109/TPAMI.2007.1108.